- India’s Blue Revolution – Fish farming contributes ₹1.75 lakh crore annually to India’s economy and supports millions of livelihoods
- High Profit Potential – A 1-acre pond can generate ₹6–8 lakhs net profit per year with smart species selection and feed management.
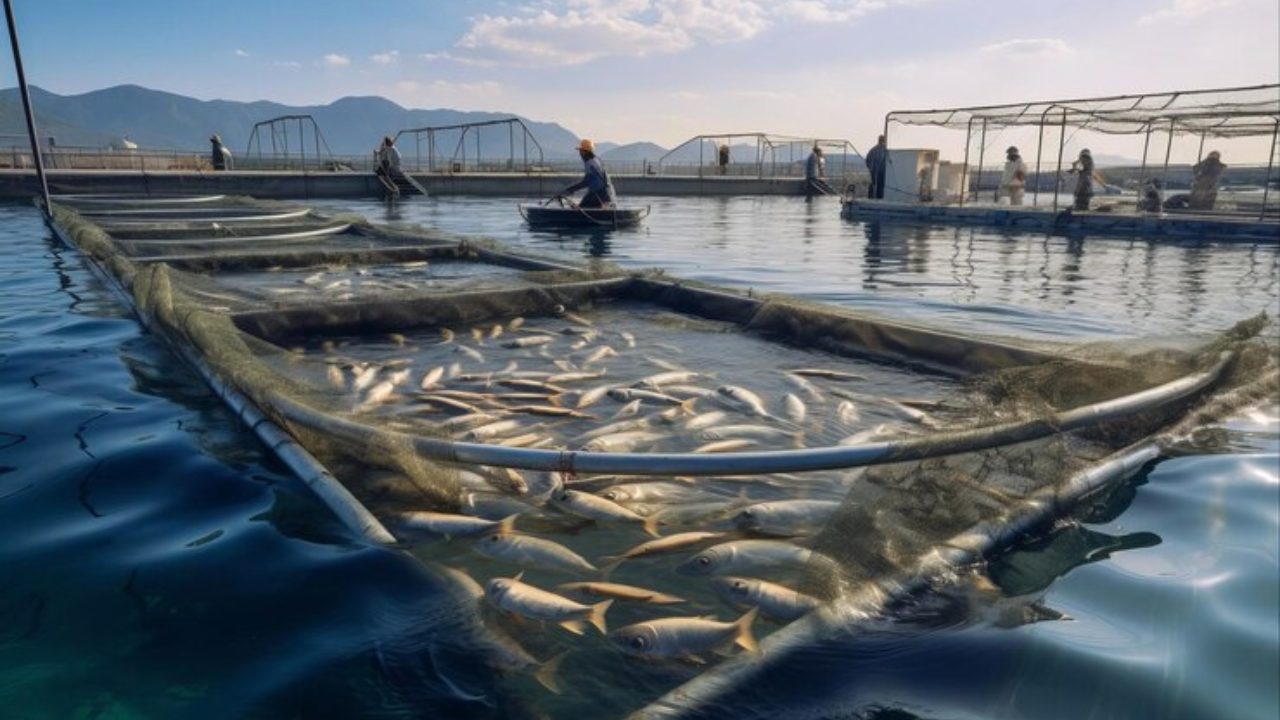
- Species Strategy – Popular choices like Rohu, Catla & Tilapia can give 30–50% higher returns compared to random stocking.
- Efficiency Matters – Scientific pond design & aeration can reduce mortality by 25% and boost growth rates significantly.
- Government Push – With subsidies up to 60% under PMMSY, fish farming is among the most supported agribusinesses in India.
If you’re searching for a fish farming business plan that’s simple, complete, and practical, this guide is for you. Below you’ll find clear steps—from choosing a model (pond, biofloc, RAS, cage) to stocking density, FCR, costs, subsidies, marketing, and a ready-to-use calculator—so you can plan, launch, and scale a profitable aquaculture business.
Why Fish Farming Now?

- Demand is strong & growing: World aquaculture hit a record 130.9 million tonnes in 2022, and farmed fish overtook wild-caught in volume for the first time.
- India opportunity: India posted 175.45 lakh tonnes of fish production in FY 2022–23 and keeps investing via PMMSY and FIDF to expand aquaculture.
- Efficiency lever: Good feed management (FCR ~ 1.5–2.0 for tilapia in semi-intensive) is the biggest profit driver.
Tip: Start with one system (e.g., 1-acre pond or 60–100 m³ biofloc), then expand with profits.
What a Winning Fish Farming Business Plan Includes
Core sections:
- Executive summary, goals & capacity
- Market analysis and pricing
- Model selection (pond, biofloc, RAS, cage)
- Species choice & stocking plan
- Water quality plan & biosecurity
- Operations (feeding, health, records)
- Capex–Opex, breakeven analysis, funding & subsidies
- Marketing & sales channels
- Risk & compliance checklist
Table 1 – Business Plan Blueprint
| Section | What to Write | Proof/Data to Add |
|---|---|---|
| Market | Local demand, prices, buyers | Historical prices, buyer list |
| Technical | System, species, density, FCR | Supplier quotes, growth curve |
| Financial | Capex, Opex, ROI, cash flow | Breakeven & sensitivity |
| Compliance | Licenses, PMMSY/FIDF | Scheme clauses, forms |
| Marketing | Channels, contracts | MOUs, sample packaging |
Pro tip: Keep all assumptions in a single “Assumptions” sheet (see the Excel tool).
Market & Demand (Global + India)
- Global: Aquaculture is now the main source of aquatic animal food by volume; farmed > wild-caught.
- Scale: 130.9 million tonnes of aquaculture production in 2022; consumption keeps rising.
- India: Record 175.45 lakh tonnes in FY 2022–23; big policy push via PMMSY (since 2020) and FIDF (extended to 2025–26).
Table 2 – Quick Market Snapshot
| Segment | India Demand Drivers | What It Means for You |
|---|---|---|
| Fresh fish | Urban retail, HoReCa | Focus on consistent harvest sizes |
| Processing | Fillets, ready-to-cook | Add ice/packaging, get better price |
| Species | IMC, tilapia, pangasius | Choose by buyer preference first |
Note: Verify local buyer preferences before finalising species.
Choose Your Farming Model

Models:
- Earthen Pond: Low capex, land dependent, seasonal risks, simple operations.
- Biofloc (BFT): High density in tanks/liners; strong aeration, carbon source; lower water exchange.
- RAS: High capex, precise control, near urban markets, year-round output.
- Cage Culture: Reservoir/river/lake permissions; fast growth with flow; logistics & compliance heavy.
Table 3 – Model Comparison (indicative)
| Model | Capex | Skill | Density | Water Use | Typical Use |
|---|---|---|---|---|---|
| Pond | Low–Med | Low–Med | 1–5 fish/m² (species-wise) | Medium | Rural land owners |
| Biofloc | Med | Med–High | 300–3000 fish/m³ (nursery/grow-out) | Low | Land-lite growth |
| RAS | High | High | Very high | Very low | Urban premium markets |
| Cage | Med | Med | High | River/lake | Reservoir projects |
Expert tip: Start pond or biofloc; shift to RAS after you master feed & health.
Species Selection (profit + local demand)

- Tilapia: Fast growth; FCR ~1.5–2.0 (semi-intensive).
- Indian Major Carps (Rohu, Catla, Mrigal): Popular across India; polyculture-friendly.
- Pangasius (Tra): High survival, fillet market.
- Common Carp, Murrel, etc.: Niche but profitable with the right buyers.
Table 4 – Species Quick Compare (indicative)
| Species | Market Size | Growth Speed | FCR (typical) | Notes |
|---|---|---|---|---|
| Tilapia | Strong retail | Fast | 1.5–2.0 | Consistent demand |
| IMC mix | Nationwide | Moderate | 1.8–2.2 | Works in ponds |
| Pangasius | Processing | Fast | 1.6–1.8 | Fillet segment |
Tip: Lock buyers first; then lock species.
Site & Water Quality (the #1 success factor)
- Dissolved Oxygen (DO): keep >5 mg/L for robust growth.
- Temperature (tilapia): 27–32°C is the optimal range.
- Flat land, clayey soil (for ponds), reliable power for aeration (biofloc/RAS).
Table 5 – Water KPIs
| Parameter | Target |
|---|---|
| DO | >5 mg/L |
| pH | 6.5–8.5 (stable) |
| Ammonia (NH₃) | ~0 mg/L (unionized) |
| Temp (tilapia) | 27–32°C |
Note: Record DO twice daily (pre-dawn & afternoon).
Infrastructure & Equipment

- Pond: excavation, inlet/outlet, sluice, lining (optional), 1–2 paddlewheel aerators/acre.
- Biofloc: HDPE/FRP tanks or lined pits, powerful blowers, diffusers, sludge removal, and carbon dosing.
- Essentials: DO meter, pH meter, nets, grading boxes, ice boxes.
Table 6 – Sample Capex (indicative)
| Item | Pond (1 acre) | Biofloc (100 m³) |
|---|---|---|
| Earthwork & civil | ₹2,50,000 | ₹70,000 |
| Aeration/blower | ₹1,00,000 | ₹1,10,000 |
| Power & pump | ₹50,000 | ₹40,000 |
| Test kits/meters | ₹25,000 | ₹25,000 |
| Total | ₹4,25,000 | ₹2,45,000 |
Pro tip: Budget 10% contingency for spares & repairs.

Seed & Stocking Density (by system & species)
Jargon: Stocking density = number of fish per area/volume; stocking size = size/weight of fingerlings at start.
- Tilapia stocking size: ≥ 30 g recommended in controlled systems.
- Tilapia pond density: up to 5 fish/m² as per responsible farming guideline (adjust for aeration & feeding efficiency).
- Farm pond density (IMC): research shows ~7,600 seed/ha (0.76/m²) yielded strong survival/production in a trial. Use local best practice.
Table 7 – Example Stocking Plan
| System | Species | Density | Stocking Size |
|---|---|---|---|
| Pond | Tilapia | 2–5/m² | 15–30 g |
| Pond (IMC polyculture) | Rohu+Catla+Mrigal | 6,000–8,000/ha | 80–100 mm |
| Biofloc | Tilapia | 300–1000/m³ (grow-out) | 15–30 g |
Tip: Higher density requires stronger aeration and tighter feeding control.
Feed & Feeding (where profits are made)
Jargon: FCR (Feed Conversion Ratio) = kg of feed to gain 1 kg of fish. Lower is better.
- Tilapia semi-intensive FCR ~1.5–2.0 with proper feeding & water quality.
- Use floating feed (starter → grower → finisher).
- Track daily feed % of biomass; adjust by sampling/feeding response.
Table 8 – Indicative Feed Plan (Tilapia)
| Fish Size | % Biomass/Day | Notes |
|---|---|---|
| 15–50 g | 3.0–4.0% | 3–4 meals |
| 50–200 g | 2.0–2.5% | 2–3 meals |
| 200–700 g | 1.2–1.8% | 2 meals |
Note: Audit FCR weekly; small errors compound fast.
Daily Operations & Biosecurity

- Pre-dawn DO check, midday spot check, evening observation.
- Siphon sludge (biofloc), maintain C: N if using BFT.
- Keep the visitor footbath, disinfect nets, quarantine new seed.
Table 9 – Ops Checklist
| Frequency | Task |
|---|---|
| Daily | DO, feeding log, mortalities |
| Weekly | Weight sampling, FCR audit |
| Monthly | Net cleaning, partial harvests |
Pro tip: Maintain a bound register + digital sheet (mirrored data).
Health Management
- Watch for off-feed, gasping, flashing; check gills & skin.
- Prevent: good DO, stable pH, quarantine, and correct feed storage.
- Treat only with vet/fisheries officer guidance; prioritise root-cause (water, feed).
Table 10 – Rapid Triage
| Symptom | Likely Issue | First Action |
|---|---|---|
| Gulping air | Low DO | Increase aeration immediately |
| Red lesions | Bacterial | Water test, consult vet |
| Slow growth | Over/underfeeding | Re-do feed chart & FCR |
Note: Most problems start with water quality.
Harvest, Processing & Marketing
- Grade fish; harvest at target weight (e.g., tilapia 600–800 g).
- Use ice (1:1 for long transport), clean boxes, basic branding/labels.
- Channels: wholesalers, retailers, restaurants, direct-to-consumer.
Table 11 – Channel Pros & Cons
| Channel | Price | Volume | Notes |
|---|---|---|---|
| Wholesaler | Low–Med | High | Fast cash |
| Retail | Med–High | Med | Requires staff |
| HoReCa | High (stable) | Contract | Consistency is king |
Tip: Sign MOUs for off-take to smooth cash flow.
Costs, Profits & Breakeven (Worked Example)
Scenario: 1-acre tilapia pond, ~10-month cycle. Assumptions are editable in Excel. The chart above shows Revenue vs Cost vs Profit for this setup.
Key outputs (rounded):
- Production: ~7,224 kg
- Revenue: ~₹10.1 lakh
- Total cost (incl. depn.): ~₹9.4 lakh
- Estimated profit: ~₹0.7 lakh per cycle
- Breakeven price: ~₹130/kg
Use the Sensitivity sheet to see profit changes with survival (75–90%) and FCR (1.4–2.0).
Download & edit:
Table 12 – What Moves Profit Most
| Lever | Impact |
|---|---|
| FCR improvement (e.g., 1.8 → 1.6) | Big feed savings per kg |
| Survival +5% | More saleable kg without more fixed cost |
| Farmgate price +₹10/kg | Strong bottom-line boost |
Pro tip: Pay for quality fingerlings & feed—cheapest inputs often cost more later.
Funding & Subsidies in India

- PMMSY: Central scheme supporting aquaculture infra; consult State Fisheries Department for current components/subsidy norms.
- FIDF: Loans up to 80% of project cost + up to 3% interest subvention; scheme extended to 2025–26.
- NABARD (Interest Subvention): Short-term crop loans get 1.5% interest subvention + additional incentive for prompt repayment (policy-linked; check latest circulars).
Table 13 – Scheme Snapshot
| Scheme | What You Get | Who to Contact |
|---|---|---|
| PMMSY | Capital assistance (component-wise) | District Fisheries Office |
| FIDF | 80% loan + up to 3% subvention | Nodal banks/implementing agencies |
| NABARD | Interest subvention & refinance | Your bank + NABARD RO |
Note: Terms vary by state/component; verify current notifications before applying.
Risk Analysis & Mitigation
Table 14 – Risk Matrix
| Risk | Example Trigger | Control |
|---|---|---|
| Low DO | Power cut | Generator, extra aeration |
| Price dip | Seasonal glut | Contract buyers, staggered harvest |
| Disease | New stock, poor water | Quarantine, biosecurity SOPs |
Tip: Keep 30–45 days of running-cost buffer.
Licenses & Compliance (Checklist)
- Farm registration with the State Fisheries Department; NOC as required.
- Water use/groundwater permission (state-specific).
- Cage culture: reservoir authority permissions & environmental clearances (where applicable).
- PMMSY/FIDF documentation if availing support.
(Confirm exact local requirements with your district office.)
Table 15 – Compliance To-Do
| Item | Where |
|---|---|
| Registration/NOC | District Fisheries Dept. |
| Power connection | DISCOM |
| Scheme forms | Department/Nodal Bank |
Note: File and track approvals early to avoid delays.
Sustainability & ESG

- Reduce effluents (biofloc or partial recirculation).
- Responsible tilapia farming to prevent escape; follow stocking & biosecurity norms.
- Source feed responsibly; try by-product inclusion where feasible.
Table 16 – Practical ESG Steps
| Area | Action |
|---|---|
| Water | Reuse/settlement ponds |
| Feed | Track FCR & wastage |
| Biodiversity | Fencing, screens, no escapes |
Tip: Sustainability often lowers costs (less waste = more profit).
12-Month Implementation Timeline (Pond Example)
| Month | Task |
|---|---|
| 1–2 | Site prep, capex, power |
| 3 | Water fill, liming, aerators |
| 3–4 | Stock seed, start logs |
| 4–10 | Grow-out ops, sampling |
| 10 | Harvest, settle accounts |
| 11–12 | Maintenance & plan next cycle |
Note: Biofloc/RAS timelines are similar, with more emphasis on system cycling.
KPIs & Records (Your Control Panel)
| KPI | Target |
|---|---|
| Survival | ≥ 85% (tilapia) |
| FCR | 1.5–1.8 (tilapia, semi-intensive) |
| Mortality/week | < 0.5% |
| DO (pre-dawn) | > 5 mg/L |
Tip: If a KPI slips, pause expansions until fixed.
Conclusion
A profitable fish farming business plan is built on the basics: match species to your buyers, control water and feed (hit your FCR), choose the right density, lock in offtake, and use schemes like PMMSY/FIDF/NABARD to optimise capex and interest. Start small, measure everything, and scale what works.
Explore more blogs to boost your farming knowledge and make smarter agri-business moves
FAQs
One acre is a practical start for pond culture; biofloc can start from 60–100 m³ in small plots.
Tilapia or IMC mix—both have strong market demand; pick what local buyers want.
For tilapia semi-intensive, 1.5–2.0 is common with good management.
Tilapia 2–5 fish/m² (with proper aeration/feeding); IMC polyculture 6,000–8,000/ha.
Typically 8–10 months to reach 600–800 g in ponds; faster in intensive systems.
Varies by brand/protein; use your local rate in the calculator to see the impact on ROI.
Meet your District Fisheries Office; components & percentages vary by state and year.
Yes. FIDF provides long-term finance (up to 80% loan + up to 3% subvention) for infrastructure; PMMSY is a broader mission with multiple components.
Farm registration/NOC, water use permissions, and cage/river permissions, where applicable (check your state rules).
Use the Excel tool with your local prices, FCR, and survival to see breakeven analysis and ROI.


")